Random Post: Sharing My MBA Adventure
RSS 2.0
  • Home
  • About
  • MBA Guide
  • Print Ad Blog
  •  

    The 8 of 10 Paradox

    March 31st, 2011

    An eight – above average but falling short of the best. This is what I find when I ask people about their Excel skills.  In fact I would wager that this is what most people would say about their skills with any tool provided one thing.  The sole criteria for being an 8 is that they have used the tool enough such that their usage would be self-defined as frequent or occasionally (as opposed to used once or once a year).  The problem is, of course, that we don’t live in Lake Wobegon.  But if you ask people, person after person will tell you an 8.

    I am not immune to this.  In fact, I claim to be an 8 of 10 in the business non-statistical application of Excel.  To me this means that I am not responsible for knowing the advanced mathematical and statistical formulas used in Excel, nor do I know how to write advanced VBA code from scratch.  What it does mean is that I know my way around PivotTables (and getpivot – both syntax options), am well versed in formatting data/graphs, can use a variety of text formulas (len, mid, right, left, proper, etc.), lookup formulas (vlookup, hlookup, index, etc.) and other advanced worksheet formulas (indirect, match, find, search, sumif, etc.), know how to create a dynamic named range, write basic VBA code, and create basic custom number formats (including if/then logic).

    I know that I have shortcomings as well.  I don’t have the syntax for custom number formats memorized, array formulas still take a bit to figure out (and I don’t often think to use them), my VBA skills could use some polish, there are a bunch of keyboard shortcuts I don’t have memorized, and I don’t use many advanced Excel Add-Ins that turn it up another notch.  I’m sure there are others, but the point is that I know I have room for improvement and see examples of really talented individuals when I read blogs or when I am searching for an answer to an issue.

    The point is that I feel like I am a well informed 8.  I am not saying I am an 8 because it just feels right.  I’m saying I’m an 8 because I put in time to learn what I don’t know.  I have been in rooms where I’m not the best, but clearly quite a bit more advanced than a large percentage of the room. And yes, I would wager money that I am not so smart that I can escape the unknown unknowns.  So I am an 8 and I know it for a fact.

    And hence the 8 of 10 Paradox.  Or, rather, the Downing Effect wherein “people with a below average IQ to overestimate their IQ, and of people with an above average IQ to underestimate their IQ” and “the ability to accurately estimate others’ IQ [is] proportional to one’s own IQ”.  Applied more broadly it is called the Dunning-Kruger Effect.

    So remember, as you go through life, people will always be comparing themselves to others.  Knowing your results in comparison to the average just makes us feel better.  But there will be times when there is not quick test score to compare; no easy benchmark to measure against.  There will only be an opinion.  At that moment you should really stop, be honest with yourself, and consider which side of the Dunning-Kruger effect you are on.

    I give this post an 8/10.  What would you give it?

    This has been a Thought From The Cake Scraps.


    Conversion At Carnival Cruises

    March 2nd, 2010

    Well, their advertising got me in the door.  I decided to check out what this whole cruise thing was all about.  It looks like a great time, but I can’t help but think that their User Experience could be significantly improved (and therefore their conversion rate). Carnival is making some HUGE mistakes.

    Making sure you have a usable website, one that is intuitive and easy to navigate, is a key element of converting your visitor into a sale.  Lets take the first page after I entered in some information about where and when I wanted to take a cruise:

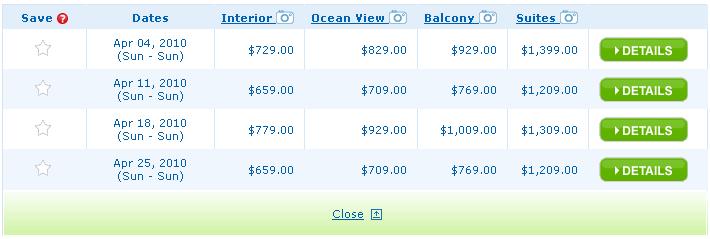
    The first thing I notice is that I am left to assume that these are per person rates.  Maybe it says that somewhere on the rest of the page, but this section is clearly the focus.   Making sure your user knows that this is a per person rate will save on hard feelings down then line.  After all, I am booking a room and rooms (at hotels) usually don’t care if you have 1 person or 2.  If I have never been on a cruise (and I have not) I could easily assume these are rates per room.  Update: It does not say that on the page, only when you hover over the lowest price (not shown in picture); does not show up when hovering over any of the other prices.

    Next I see that the base room would cost me $729 while the Suites will cost $1,399.  That’s quite a difference.  I wonder what I get for $1,399.  Let me click on the “Suites” link with the camera icon.  This is what will sell me on getting the expensive room.  A nice overlay pops up on top of the current page looking like this:

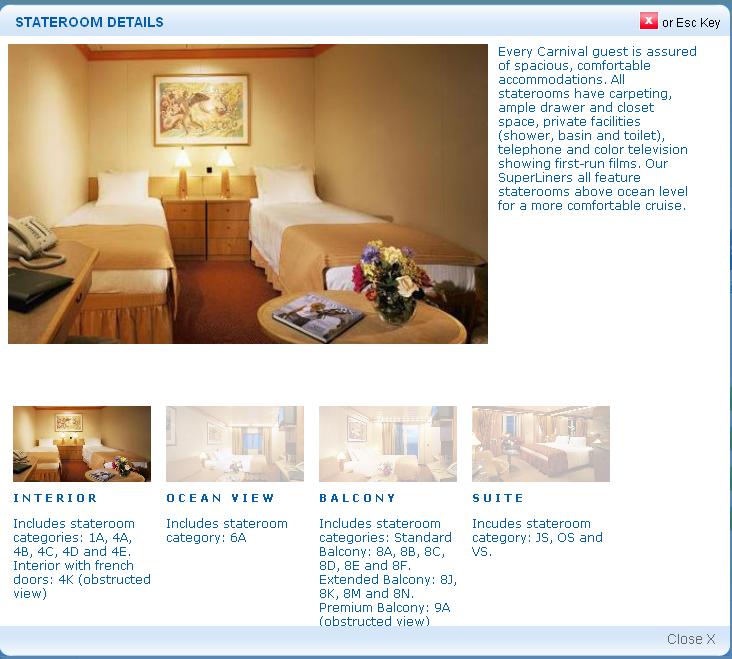
    Hmm…the first thing I notice is that I clicked on the Suite and the picture that pops up looks pretty unremarkable for the price.  Oh wait, the Interior room is selected.  Huh?  That seems like a pretty big miss.  But okay, I figure that out and click the suite.  I give them another chance to sell me on the room.  And…it is just an enlarged picture of the little thumbnail.  Thus far I am not convinced that I will double the price of my cruise.  But what could they do differently?

    First, they could give me more pictures.  It is basically free for them and would do tons to help convert me.  Some pictures that I would love to see:

    • What does the view out the balcony look like?
    • How big is the balcony?  What does it look like?
    • Is there a TV (like in the other rooms)?  Where is it?
    • How big are the closets?  Where are they located?
    • What does the bathroom look like?
    • It says it has a large vanity/dressing table…where’s that?
    • A whirlpool tub is listed.  Again, what does it look like?
    • How big is the desk in the corner of the room?

    All of these things are items that people want to know.  They want to know what they are getting for their dollar.  Instead there is one generic shot that does almost no good.

    The next things is the text below the single picture: “Includes stateroom category: JS, OS and VS.”  Ohh, right.  Category JS.  I’m not sure what JS means to them but to me it means Jack Squat.  Why would these letters have any meaning to me?  And, to make matters worse, I cannot click them to figure out what the heck they are talking about.  It is just meaningless text unless I’m some sort of cruise expert in which case I wouldn’t be on this page to begin with!

    Sorry Carnival, I’m not even all that interested in what your big green details button would give me.

    What do you guys think?

    This has been a Thought From The Cake Scraps.

    Office 2007 Most Useful Ad-In

    October 21st, 2009

    I was working on my laptop today and was playing around with my newly installed Office 2007.  I really need to get to know it more, but work still uses 2003 and I have become quite good at using the 2003 version.  Some co-workers are even generous enough to put me into the category of Excel Expert.

    I’m not sure about all of that, though I have done some posts on cool Excel tricks, but I do know one thing.  I don’t have nearly as good of handle on 2007 as I do on 2003.  The I remembered something that @Fantastical7 told me that had changed my life on my desktop computer.  The Office 2007 Search Ribbon.

    This is the best download for Office that you have never heard of.  If you are having trouble figuring out where that old command went in the new ribbon structure, this add-in is perfect for you.  No more scouring the internet for answers to simple questions.  Just simple answers that are quick and, best of all, are exactly what you are looking for.

    At the time of this post, only 64, 169 had downloaded this add-in.  I have to say that that is a bad indicator.  I just wonder how much time people have wasted looking for the buttons when this add-in makes it super simple.

    So, what do you think of Office 2007?

    This has been a Thought From The Cake Scraps.


    Quick Windows Tip

    August 10th, 2009

    Every now and then a person stumbles across a small tip that makes life easy. Well, maybe just easier. Today I share one of those tips with you, the shift key.

    We all use the shift key, but few people know about the additional power that it can provide. Gone are the days where it is used just for making a letter upper case or YELLING on the internet.

    On a Windows OS,  holding the shift key while right clicking an item in a folder allows you to open the document read-only.  Very helpful if you don’t want to lock people of of the document, but still want it open.

    The second and more helpful trick that I learned is in Excel.  Have you ever wanted to have a single page summary, but just couldn’t get it to work because the column widths for the stuff above doesn’t match with the stuff you want below?  Shift can help.

    Copy the area that you want and then hold shift and go up to Edit > Paste Picture Link.  You now have a picture that is easily moved around, no matter the above column structure.  Better yet, if you change anything in the original range, it changes along with it!

    Update: As commenter Ryan, of RyanMalesevich.com fame, points out, this is for Excel 2003.  For 2007, no shift is needed.  Just click the down arrow below “Paste” > “As Picture” > “Paste Picture Link”

    Do you have any tips to share?

    This has been a Thought From The Cake Scraps.


    Excel Dynamic Data Validation Range: Indirect

    February 24th, 2009

    magic-trick-799126In the world of dashboard and report generation every little trick can help.  The trick might save you time, make something possible, or just look pretty sweet.  I think that any one of these is a great reason to employ an Excel trick, but I have to be honest; I am partial to the last one.

    The reason that I love Excel tricks that look sweet is that often times if it looks sweet then it is also more likely to be used and appreciated by others.  On top of all of that it can be fun just seeing what Excel can do.  With all of that in mind, I give you my first post on Excel Tips and Tricks: Creating a Dynamic Data Validation Range.

    The first tool that you will need is the “INDIRECT” formula.  The INDIRECT formula takes a text string and evaluates it as a range.  So, whereas normally a formula might say ‘=sheet1!A6’ and INDIRECT would look like ‘=INDIRECT(“sheet1!A6”)’.  The main difference is that the second formula is text and can be broken up into text segments and concanated together like this ‘=INDIRECT(“sheet1″&”!A”&6″)’ which is the key because then any component within the INDIRECT can be part text part cell references, calculations, formulas, etc.  Here’s and example of that ‘=INDIRECT(“sheet1″&”!A”&3*2)’ or if cell B1 had a value of 6 in it ‘=INDIRECT(“sheet1″&”!A”&B1)’.  All of these formulas would return the value that is in sheet1!A6.

    Whew! Take a deep breath after that.  Perhaps take a second to play around with it because the next part relies on it.

    The difficult part about using data validation in a cell is that the data validation range must be in the same sheet as the cell you are validating.  Unless you use a named range.  You cand define a named range in 2 ways.  The first is to select what you want and then in the box in the upper left corner of the sheet type a name.  The second is to use Insert > Name > Define (2003) or Formulas > Defined Names > Define Name >Define Name (2007)

    Here’s the setup.  I am entering “List of Letters” in Sheet2!A1 with letters A – F in column A rows 2 – 7.  Select Sheet2!A1:A7 and type “Data” into that box in the upper left corner.  You should now have a named range called “Data”.

    Then in cell Sheet1!A1 Use Data Validation and select List for the “Allow” drop box.  For the source type “=Data”.  You should now have a drop down in Sheet1!A1 that has all of the values from Sheet2!A1:A7.  Now you have applied Data Validation to a cell that pulls from a list on a separate sheet.  Nice.

    Now for that extra piece of flare.  We need to redefine this named range.  For this go back into the Define Name – select the name and click edit; in 2007 use the “Name Manager”.

    Now, we get to use the INDIRECT from before.  We will start off nice and simple.  While the current name should be defined as ‘=Sheet2!$A$1:$A$7’ we will just make that and INDIRECT so we get : ‘=INDIRECT(“Sheet2!$A$1:$A$7”)’.  Now we want to change this so that we know how far down to go.  Right now we go to A7, but what if things are added.  We would have to redefine the name every time.  Luckily, we can use the COUNTA formula to count the number of non-empty cells.  In this case COUNTA(Sheet2!A:A) should equal 7 (one for the heading and one for each letter).

    Lets throw that into our named range definition in place of the last “7” so that we get: ‘=INDIRECT(“Sheet2!$A$1:$A$”&COUNTA(Sheet2!$A:$A))’.  Notice that we have to put in the quotation and ampersand right before the COUNTA because we are building a text string.  As a final touch lets say that we don’t want the heading the drop-down box in Sheet1!A1.  We have to change the row that the range starts on so we get : ‘=INDIRECT(“Sheet2!$A$2:$A$”&COUNTA(Sheet2!$A:$A))’.

    As a final wrench, lets just say that the list on sheet2 is moved from A1:A7 to A:3:A9 with A1 and A2 blank.  Here we would just have to add something to the formula on the end to pad it for the blank rows and change the starting row.  In this case we would end up with ‘=INDIRECT(“Sheet2!$A$4:$A$”&COUNTA(Sheet2!$A:$A)+2)’

    Let me know your thoughts on this post and if this worked for you!

    This has been a Thought From The Cake Scraps.


    Don’t Lose Sight Of Your Benchmarks

    January 20th, 2009

    In any field it is easy to look at day over day comparisons, week over week, month over month, and even year over year.  If you are diligent you might even go so far as to trend your data over time.  Perhaps you will include a trend for the current time period as well as a trend for the historical time period.  The graph will be very pretty I’m sure.  That is all great stuff.

    The problem with all of this is that it is far too easy to get caught looking at the micro picture without ever taking the time to step back to look at the macro picture.  Where were you at the pinnacle of your stats?  Where were you at the depths?  And not just in the time period you are comparing.  I am talking about ever.

    These are the things that you need to be aware of.  Not with every project you do, but just in general.  This gives you perspective.  Have your sales been increasing each year?  Great, maybe they have even been increasing for the last 4 years.  Even better.  But what if you are still at half of your sales from your peak 15 years ago?  The company was capable of doing it then.  Ask yourself “why are we not at that now?” and then try and figure out how to get there.

    Don’t be satisfied with being close to the industry average.  While it is great to know where and how you tack up against others, it should only be a component of your overall picture.  Who cares if you are far above average on conversion?  Someone has to shoot for the stars.  Somebody has to be the new benchmark.  It can be you.

    The point is that as an analyst, and we are all analysts to greater and lesser extents – in your job or not, you need to be aware of the overall picture.  Don’t just be a reporting monkey.  Know your stuff.  Know what potential there is.

    And if you are setting a new benchmark, then pat yourself on the back.  You deserve it.  But then ask, how can I (or we) push that even further.

    How have you pushed a benchmark in your life?

    This has been a Thought From The Cake Scraps.


    Estimating Demand Impact And Conversion Rates

    December 30th, 2008

    I was recently working on an interesting project where I was estimating the demand impact of a change that we had implemented to our site.  Without getting into the details, a change was made so that the customer would be less distracted during their shopping experience.  This then – hopefully – keeps the visitor more engaged with the site and if everything else goes well, they will then buy.

    The tricky part is that the likelihood to convert changes at different points on the site, though it is a bit difficult to get it.

    For example, if all a visitor sees is the homepage, they are going to convert at some percent.  Assume 10% for easy math.  If a visitor doesn’t bounce – meaning come to the site, see one page, and leave – say the percent to convert increases to 20%.  If the visitor then sees a product page they are now going to convert 30% of the time.  And finally if they enter the checkout process they will convert 40% of the time.  The point is that the level that the customer is at in the site changes the likelihood of conversion.

    This seems like it would be a very obvious thing, and to a certain extent it is.  The key component here is not that these differences exist and you know about them.  The key is taking that knowledge into account when making an estimate for demand impact of a change.

    If visitors have all of these different conversion points and a change is made that causes 1,000 visitors to not leave the site you need to take these conversion points into account.  Saying that the 100 more people will buy (using 1,000 visitors * 10 % conversion from homepage) is just as misleading as saying that 400 people will buy (using 1,000 visitors * 40% conversion rate from checkout pages).  When making a demand impact, make sure that you include a few inputs for these different areas.

    For example: 100 visitors * 10% + 300 * 20% + etc.  As long as the percents add up to 100% and the visitors add up to your total you are in good shape.  You can then take this number times your average order value and you now have a demand estimate.  Note that you could even take this a step more and apply a different average order value to people who have been in different areas of the site.  For instance someone who is shopping for Outerwear or A laptop will probably have a different average order value then an individual looking at flip-flops or computer cables.

    Ultimately you can segment this to any level that you are able to get.  Just make sure that the work that you put into arriving at the final number is worth it – especially if you are using the Omniture Excel Client.  Make a judgement call.  If it is just going to be small dollars or you really just need a ballpark then take the 1,000 visitors * 25% or something like that.  It is a guess, but it should be an educated guess.  Each different analysis will require varying levles of confidence.

    Have you done anything like this before?  How did it go?

    This has been a Thought From The Cake Scraps.


    What’s In A Name

    October 28th, 2008

    The name that you pick for your product, service, blog, etc. is part of what defines your brand.  If you have read my blog you may remember the post about knowing what you are worth as a brand, but what that post didn’t talk about is the name of the brand.

    The name of your brand is the first thing that people associate with a product.  People don’t usually start talking about a product without saying who makes it.  It is a critical element to the story of the product.  The part that boggles my mind is how odd some names are.  The names defy logic.  Take Cuil for instance.  The first clue is that if I say Cuil – said cool – you probably have no idea how to spell it.  If you have to spell your brand name to people I think you substantially decrease the odds of starting a brand.

    I have to admit that I even broke my own rule in the first edition of this blog by calling it “Thoughts From Thee Cake Scraps”.  There is a reason that I called it “Thee” but it doesn’t matter.  The reality is that when I was telling people about this blog I would have to say “Thee” and make sure that they doubled up on the “e”.  That is no way to tell people about your new product.

    I am sure there are exceptions to this rule, but I am equally sure that many more odd brand names have failed than have made it.  Note that when I say odd I mean how easily you can communicate your brand name.  It doesn’t have to make sense, just make it easy to communicate.

    This has been a Thought From The Cake Scraps.


    You Are Being Tracked: Product Page Finding Methods

    October 13th, 2008

    More often than not if you are somewhere you know how you got there.  Hopefully you don’t have too many weeknights (weekends I will exclude) where you just wake up and have no idea how you got to where you are.  You may be smart enough to know how you arrived at a particular location, but your website – at least by default – is not.

    This post covers the principle of having a Product Page Finding Method (PPFM) tag on your site.  If your site was successful in getting a visitor to a product page, you should really know how they got there.  And if you are a visitor you should know that this is one more way you are being tracked.  For more information on being tracked check out my posts on Internal Campaigns and E-Mail tracking.  I will point out now that this post is less about describing to a visitor how they are being tracked and more about how a website should track the visitor.  This is because a PPFM tag is less common and may not apply to many sites a visitor may go to.  Nevertheless, it is still something to keep an eye out for.

    Back to tracking how a visitor got to a product page.  The easy solution is a ‘Next Page’ or ‘Previous Page’ report.  This will tell you what pages a visitor was going to or coming from, respectively.  It may seem like the answer to our question of how the visitor arrived at a product page, and it does at a simplistic level, but is of no use for aggregating data.  Consider an index page that lists all of a companies laptops.  How often does a customer click through to an individual laptop (a product page)?  There is no easy answer to this if you have more than a few laptops displayed.  A PPFM tag will solve this problem.

    If you add a PPFM – that’s Product Page Finding Method – tag to each link on the index page then when the visitor clicks through to a product page you can tell Omniture to look for PPFM=INDEX_Laptops01 and it will store it to an e.var ( a commerce variable).   Then you can run a report in Omniture and look for instances of INDEX_Laptops01.  Compare that to the Page Views for your laptop index page and you have the rate at which a person is clicking form that index page to a product page.

    Another trick is to make sure that all of your index pages are tagged and have INDEX in the PPFM tag.  That way you can actually do a search to pull back all instances of an index page click on any index page.  With any luck you have your pages named in a similar fashion – so you can get total index page views – and you can then get a site-wide rate that people are clicking though to your products from your index pages.

    Now that we understand the concept of a PPFM, lets look at a few other uses for it.

    Basically, you should not have an instance where a customer navigated to a product page and you do not know how they got there.  Other ways they could get to that product page include a ‘direct to product page’ search and a cross-sell placement from another product page.

    The ‘direct to product page’ is useful if you have a search box that will allow a customer to go directly to a product page without going through an index page.  An additional way to tag this would be to have a search results tag – for instances when a search returns many products – and then any click from that index/search page to a product page would give credit to the search tag.

    The cross-sell tag would be used on any product page where you are displaying some other products the customer might also like to buy.  Any click on these links will bring the customer to another product page and then the cross-sell tag would get credit.  You might also have a similar tag for items displayed in the cart.

    The last thing to discuss is credit.  On a $100 order who gets the credit.  The simple way to do it is the last used tag.  The bad part is that with this method if a customer uses and index for the first 3 items and the last item they clicked a cross-sell item, the cross-sell tag will get all of the $100 attributed to it.  That isn’t really accurate.  The better way is to distribute the $100 via linear attribution.  That means that in the example above each of the index pages would get $25 and the cross-sell would get $25.  The tricky part here is that if a customer is browsing they may click to 10 different products from 10 different index pages and each of the index pages would get 1/10 a share of the revenue even though the customer only bought from one of the index pages.  Just something to keep in mind.

      With this tagging in place on your site you should always be able to answer how a customer arrived at your products.  It does not quite answer the question on a page by page basis – i.e. for Product A the PPFM tags used to arrive there were cross-sell 24%, indes 53% etc. – but it will give you a much better idea, on the whole, how your visitor is getting to your product pages.  Just a little tip that can save a ton of work

      This has been some Thoughts From The Cake Scraps.


      You Are Being Tracked: Internal Campaigns

      September 22nd, 2008

      So you know that you are tracked by e-mails.  You are going to beat the system.  You are not even going to use a search term to get to the website because you know Google will track you along with the website.  You are going to direct load – typing the URL into the address bar – and avoid being tracked.  Almost, but no.  Chances are that the site gave you a cookie last time you were there.  Oh well, you tried.  But that is not what this post is about.  Just because you got to the site without tracking, does not mean that you will not be tracked.

      Internal campaigns are exactly what they sound like.  They are campaigns that are internal to the site.  A campaign is anything that the site is doing to try to get you to buy more stuff (or whatever the conversion metric would be, such as filling out a survey or something).  E-mails are campaigns.  Billboards are campaigns.  A site or company runs advertising campaigns. You get the idea.

      The banner that you see across whatever site you are on is sure to include an element that says that you clicked it – a tag.  Note that I am only talking about a banner that is on the site and for the site, not an advertisement for a different site.  The advertisement for a different site would be an external campaign for the company that bought the ad.  We are talking about an ad for another item on your site – perhaps for an LCD monitor when you are looking at computers.  I call this a real estate campaign or an internal campaign.  I call it real estate because the site is tracking based on the tag on the banner and the site knows the location of the banner, the real estate. I call it an internal campaign because it is for another product that will take the visitor somewhere else internal to the site, not push them out the door to an external site.

      So you clicked the banner and were tagged.  It is in this way that the site can track how often the banner is being used (instances) as a rate of how many people saw the page it was on (page views).  This also allows the site to understand where someone is clicking on the site.  Each area of the banner could contain a different tag, thus if you clicked the t-shirt you could get tagged with a value of tshirtclick while if you clicked the jeans on the same banner you would get tagged with a value of jeansclick.

      Internal campaigns are very useful for a site because they allow for a wide variety of reporting.  The site will know how many conversions they got that clicked on the banner and how much revenue is associated with it.  This also is a much easier way to track traffic from a page.  Perhaps a single page has multiple banners and the site wants to know how many people clicked the banners.  With no tagging on the banners, all the site would be able to do is look at what pages visitors went to next and add them up.  For instance if there is no way to get to the jeans page from your home page and yet 20 of the 100 visitors took that path you can assume that they must have clicked on the jeans banner.  But then to add that up with the page that took them to the t-shrits and the page that took them to the pants, and to…etc. is a huge pain. By the time you get to the number of estimated clicks (because in theory they could have the page bookmarked or something like that) you won’t care any more.

      Look for more the post forthcoming about purchase influencer tagging on Thoughts From Thee Cake Scraps.